Monday, March 11, 2013

Aplikasi GraphViewer v1.3 [java] Penampil Grafik dan Kalkulator (Scientific Calculator)

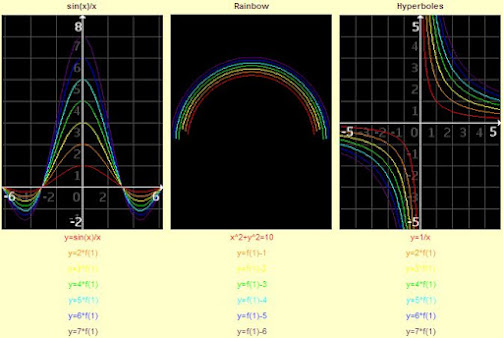
Aplikasi ini menurut saya salah satu aplikasi terbaik untuk Handphone dengan sistem operasi Java yang bernama GraphViewer. Bagaimana tidak, GraphViewer mampu menampilkan Grafik dari Sistem persamaan atau fungsi matematika. Aplikasi ini dapat menampilkan :
1. Persamaan Liniier
2. Persamaan Kuadrat
3. Parabola
4. Hiperbola
5. Fungsi Trigonometri
6. Fungsi Turunan
7. Fungi Intergal dan masih banyak lagi.

Lebih lanjut mengenai fitur dari aplikasi GraphViewer ini Klik Show.
Features
# The solutions (null points) of an equation will be shown
# The first and second derivate can be shown
# Show the integral of a function
# You can calculate the local minima and maxima of the function
# You can calculate the function inflection points
# The intersection points of the different equations are calculated and can be shown
# You can interactively evaluate the functions at their critical points
# You can show a function table with the function coordinates at its critical points
(So the null points, minima, maxima, inflection points... are automatically calculated)
# Build-in samples show the possibilities of all functions
# Calculate any function point up to 12 decimals.
# Multiple functions can be plotted in different colors at once
# In the settings you can set the internal precision, so you can choose between low precision (fast) or high precision (slow), depending on the speed of your mobile.
# You can save your equations and add them to the samples library of the Graph Viewer.

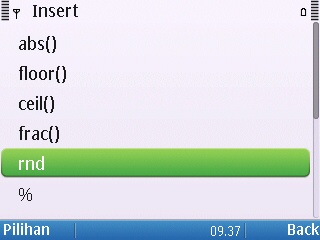
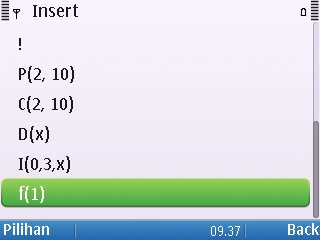
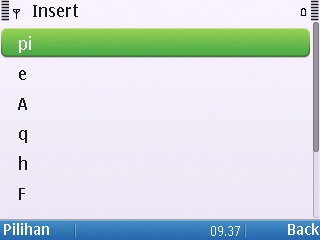
Inilah yang saya suka dari Aplikasi GraphViewer, selain untuk menampilkan grafik, GraphViewer terdapat menu untuk perhitungan kalkulator. Eits....jangan salah,, perhitungan kalkulatornya sangat lengkap bisa dibilang Scientific Calculator, jadi gak usah beli kalkulator mahal-mahal...hhe.
Untuk mengetahui Perhitungan apa saja yang bisa dilakukan oleh aplikasi ini, klik open untuk membuka spoiler.
Spoiler :
Post spoiler
Post spoiler
Post spoiler
Post spoiler
Post spoiler
Post spoiler
Post spoiler
Post spoiler
Post spoiler
Post spoiler

Contoh. Disini saya ingin menampilkan Grafik dari persamaan berikut:
 y = x^2 + 6x + 5
Maka, kita inputkan seperti ini :


Kemudian, klil Plot dan centang Show null points, dan hasilnya seperti ini:


Di bawah ini ada beberapa screenshots :
Spoiler :
Post spoiler
Post spoiler
Recommended banget deh buat sobat-sobat semuanya apalagi buat para pelajar khususnya anak Matematika.
Langsung aja Download Aplikasi GraphViewer.jar  v1.3 :

Artikel Terkait Lainnya :


0 komentar:

Post a Comment

 
Design by Wordpress Theme | Bloggerized by Free Blogger Templates | coupon codes